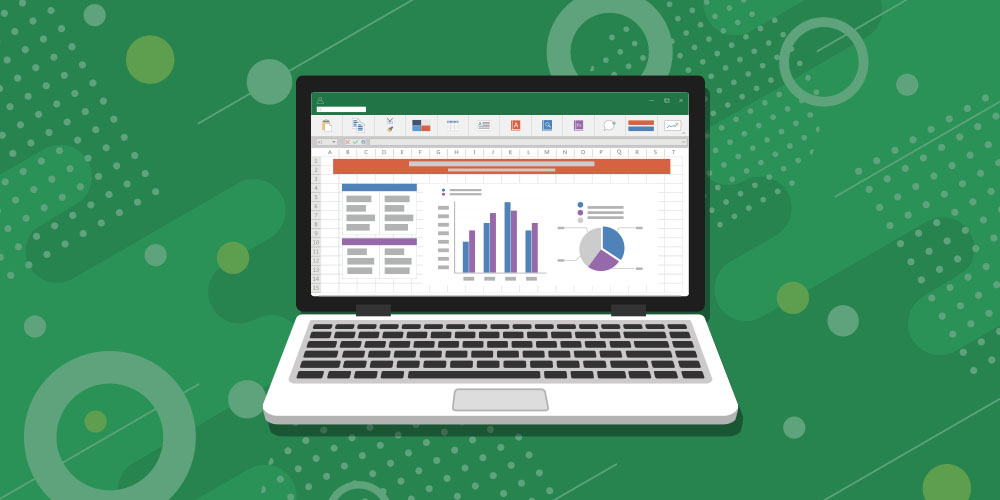
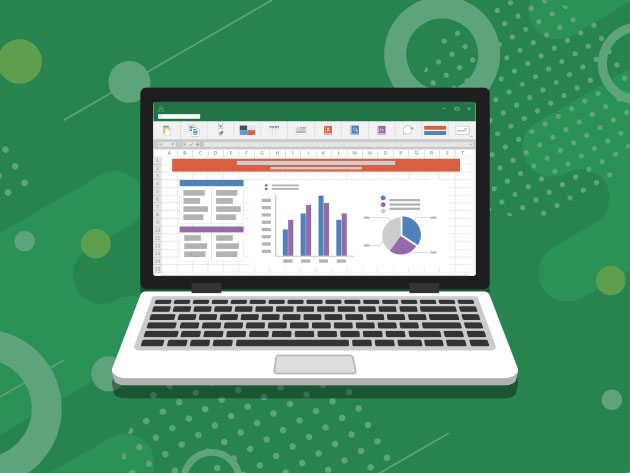
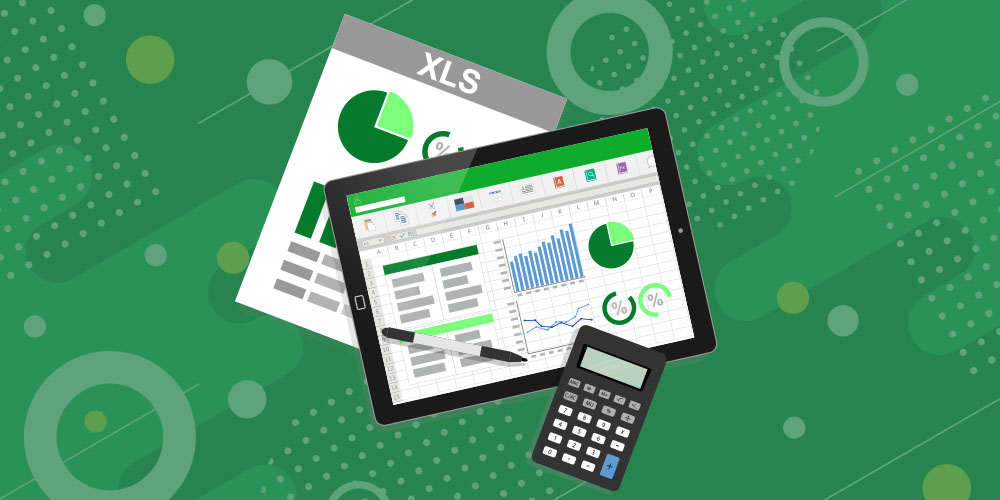
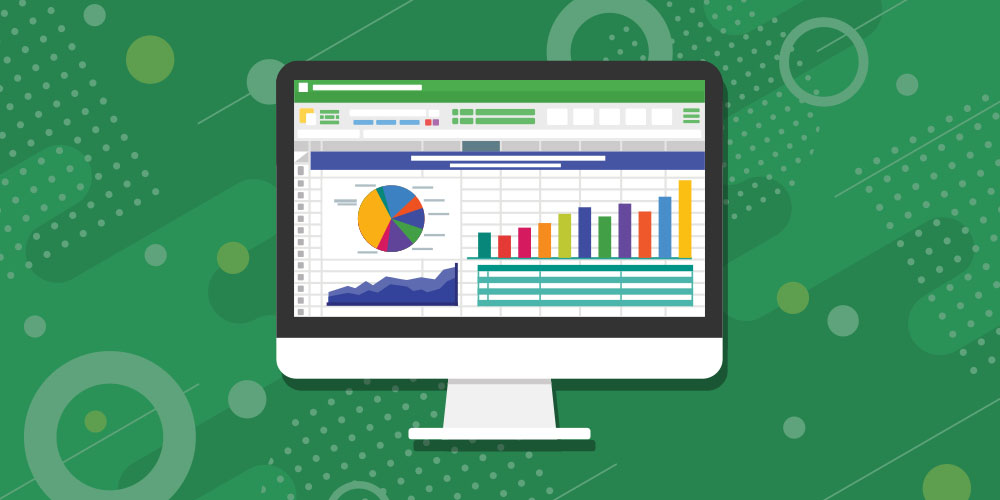
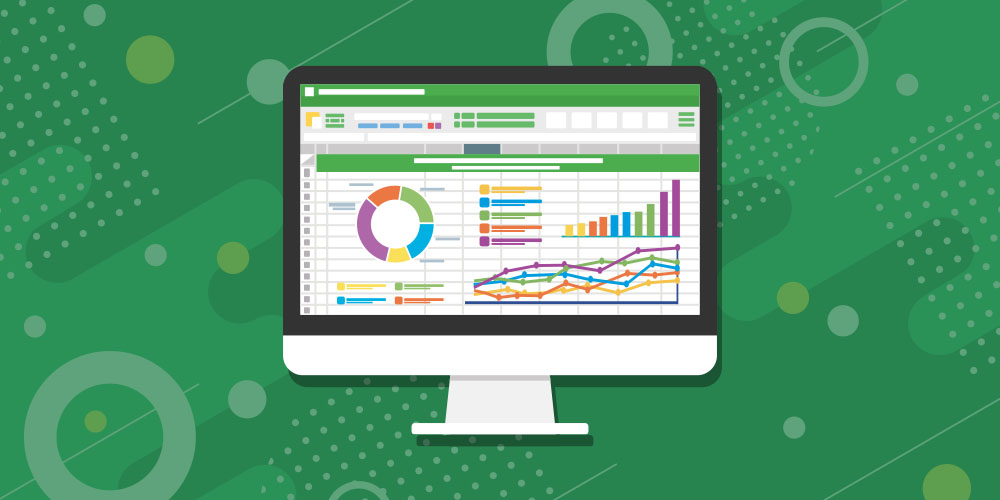
By Jordan Goldmeier | in Online Courses
In this course, you will take a quick dive into concepts such as Array Formulas and formula-driven developments. As you progress, you will see how each module builds from top to bottom. Also, you will be exposed to often overlooked features such as Excel's form controls, which can drive tremendous interactivity. At the same time, you will run through the rules of data visualization, making sure that what you build communicates its message. By the end of this course, you won't just be good at data visualization and dashboards, but also, you will become a master Excel builder.
Important Details
Requirements
By Yoda Learning | in Online Courses
If you're dealing with a bunch of data, sorting and organizing will help you a lot. This course will teach you how to use Google Sheets and organize your information into neat spreadsheets. You can use many of these skills in Excel too. Some of the topics that will be discussed here are as follow: working with Google Sheet's checkbox, sparklines for Dashboards, using slicer on a table, add pop-up calendar date picker, coloring raws based on a cell value, and more.
Important Details
Requirements
By Yassin Marco | in Online Courses
This course has been created to help you learn all the basics that are around the use of VBA with Microsoft Excel. With this course, you will first learn the power of Macros with Microsoft Excel. This will allow you to automate the majority of the task that you are currently doing on Microsoft Excel. Then, you will understand how to properly record your own macro, and learn all the programming behind a macro. Another important aspect of this course is that it will help you learn by practice. Each element enables you to sharpen your skills in Excel Macro and Excel VBA.
NOTE: Software NOT included.
Important Details
Requirements
By Maven Analytics | in Online Courses
This course will introduce you to Microsoft Excel's powerful data modeling and business tools Power Query, Power Pivot, and Data Analysis Expressions (DAX). If you're looking to become a power Excel user and supercharge your analytics, then this is the A-Z guide that you're looking for. Here, you will learn about the Power Excel landscape, explore what these Excel tools are all about, and why they are changing the world of self-service business intelligence. Take your Excel game to new heights and join the leading edge of analytics and business intelligence
Important Details
Requirements
By Maven Analytics | in Online Courses
It's time to show Excel who's boss! Whether you're starting from square one or aspiring to become an absolute Excel wizard, this is the right place for you. This course will give you a deep understanding of the advanced formulas and functions that transform Excel from a basic spreadsheet program into a dynamic and powerful analytics tool. Through hands-on, contextual examples, you'll learn why these formulas are awesome and how they can be applied in several ways. This is especially useful for including in your portfolio or resume, so future employers can feel confident in your skillset.
Important Details
Requirements
By Maven Analytics | in Online Courses
If you're looking for a comprehensive, hands-on guide to learning Microsoft Power BI Desktop, you've come to the right place. Power BI is quickly becoming the world's most powerful self-service business intelligence platform, and an absolutely essential tool for data professionals and beginners alike. With Power BI you can connect to hundreds of data sources, build complex relational models, and design stunning, interactive dashboards from scratch.
Important Details
Requirements
By Maven Analytics | in Online Courses
Pivot Tables are an essential tool for anyone who works with data in Excel. Pivots allow you to explore and analyze raw data quickly, revealing powerful insights and trends otherwise buried in the noise. In other words, they give you answers. Whether you're exploring product sales, analyzing marketing tactics, or wonder how Boston condo prices have trended over the past 15 years, Excel Pivot Tables provide fast, accurate, and intuitive solutions to even the most complicated questions. This course will give you a deep, 100% comprehensive understanding of Pivot Tables and Pivot Charts.
Important Details
Requirements
By Mammoth Interactive | in Online Courses
Start a career in data science by learning how to combine your Excel knowledge with Python programming, machine learning, and data science. Take your spreadsheets to the next level by learning the essentials of coding specifically tailored for data science in Excel. Completely tailored for beginners, this is a life-changing course you don't want to miss.
Important Details
Requirements
By Earn and Excel | in Online Courses
It is a perfect course for you if you are about to start a new role or project, or perhaps you are preparing for or a fairly in-depth interview in the next few days and you want to spend a few evenings or the weekend to bolster your Excel skills! The course is presented by the highly experienced Andrew Dove an accounting professional from the UK and covers the most important Excel topics that professionals need to be accomplished in. This course will help you get the best out of Excel.
Important Details
Requirements
By Yoda Learning | in Online Courses
The job of HR is not an easy task. Analytics is an essential part of the process of acquiring good talent, engaging them, and retaining them. Most of the processes involved are time-sensitive and repetitive. Hence, there is a dire need to automate such tasks. HR Analytics in Excel helps businesses make data-driven decisions in a meaningful way. This course will help you do just that. This course is self-paced to learn effective and interactive creation of Human Resource (HR) and Learning & Development (L&D) dashboards. Impress your management with the right data handling and report automation techniques.
Important Details
Requirements